
What Are & How to Find High and Low Liquidity Zones in Trading Explained
- VasilyTrader

- May 12
- 3 min read

Liquidity analysis is the essential part of trading Forex, Gold and any other market.
Your ability to identify and differentiate high and low liquidity zones is crucial for spotting profitable trading setups.
In this article, we will go through important Supply & Demand basics.
You will learn how to measure a concentration of market liquidity and orders on different price levels.
Take notes and let's get started.
What is Liquidity
Let me start with explaining what I mean by the market liquidity.
The orders of the market participants are not equally distributed among different price levels.
While some levels will accumulate the liquidity, some price levels will lack that.
High Liquidity Analysis
One of the proven and the most efficient way to analyse liquidity is based on price action and candle stick analysis.
Let me explain.
Candlestick Analysis & Liquidity

One of the most evident signals of a high concentration of liquidity is a formation of multiple long wicks within the same area.
Long wicks signify a dense participation of buyers and sellers.
It means high market efficiency and that every price level was traded by the buyers and by the sellers.

Multiple candles pushing up to roughly the same high, each leaving a long upper wick will signify a strong concentration of supply and inability of the buyers to breakthrough.

Multiple candles dropping to roughly the same low, each leaving a long lower wick, then closing higher will signify a strong concentration of demand and inability of the buyers to breakthrough.
Price Action Analysis & Liquidity
Price action analysis will help you identify high liquidity zones too.
The levels or the zones from where strong price movements initiate will indicate liquidity concentration.

An area or level from where a rapid bullish movement started will suggest a strong concentration of demand.
Because that level or area contained enough buying orders to absorb all selling pressure and then push price upward rapidly.

An area or level from where a rapid bearish movement started will suggest a strong concentration of supply.
Because that level or area contained enough selling orders to absorb all buying pressure and then push price downward rapidly.
Low Liquidity Analysis
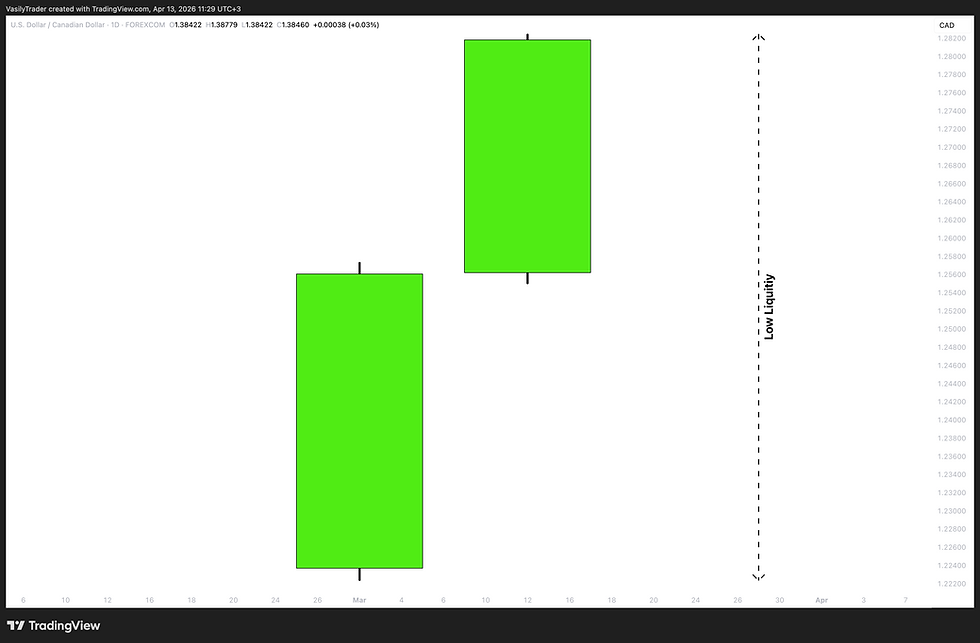
Now, let me explain how to identify low liquidity zones easily.
Strong bullish or bearish candles with tiny or no wicks are a perfect indicator of low liquidity.
High momentum bullish candles with little or no wicks will signify a clear dominance of the buyers with a very low presence of the sellers.

The absence of supply and overwhelming demand will create the market inefficiency, pushing the prices way higher until a high liquidity zone is found.

High momentum bearish candles with little or no wicks will signify a clear dominance of the sellers with a very limited buyers' participation.

The absence of demand and overwhelming supply will create the market inefficiency, pushing the prices way lower until a high liquidity zone is found.
Liquidity Analysis Example
Now let me show you how a complete liquidity analysis should look like.

The blue zones above are high liquidity zones on GBPCAD forex pair.
While gray zones are low liquidity zones.
These areas are identified using the rules that we discussed above.
Summary
Price action and candlestick analysis are powerful tools in measuring the market liquidity on different price levels.
It will help you better orient yourself and make more accurate predictions in trading Forex or any other market.


