
How to Find Buying/Selling Imbalance Easily? Use This Powerful Candlestick Pattern!
- VasilyTrader

- Jan 27
- 3 min read
Updated: Feb 26

Just one single candlestick pattern helps me find selling and buying imbalances and predict future price movements on any Forex pair.
In this article, you will learn one of the most accurate imbalance candlesticks that I use for trading Forex.
I will explain the psychology and meaning of this pattern and show you how to find it easily.
Selling Imbalance Price Model
Let's start with discussing a bearish model of this candlestick pattern.

It will be strictly based on 3 consecutive candlesticks.
The first one should be a normal bullish candle with an average-sized body and relatively small wicks.
It will signify a bullish sentiment on the market.
The second candlestick should be a weak bullish, bearish candle, or doji. It can also be a pin bar with a long upper wick. Such a candle should strictly form after a test of a liquidity supply zone.
Such a candlestick will be very important.
It will signify an absorption of buying orders by the sellers, by the selling orders that are placed within a supply zone.
The upper wick may also go beyond a liquidity zone.
It will signify a liquidity grab and a trap for the buyers.
The third candle should be a strong bearish candlestick with a big body.
The body of this candle should engulf the entire range of the first bullish candle.
It will signify a strong selling imbalance and confirm a change of the market sentiment.
A bearish continuation will be expected then.
Selling Imbalance Strategy
To trade this pattern, simply wait for a bearish imbalance candle to close, engulfing the first bullish candle.
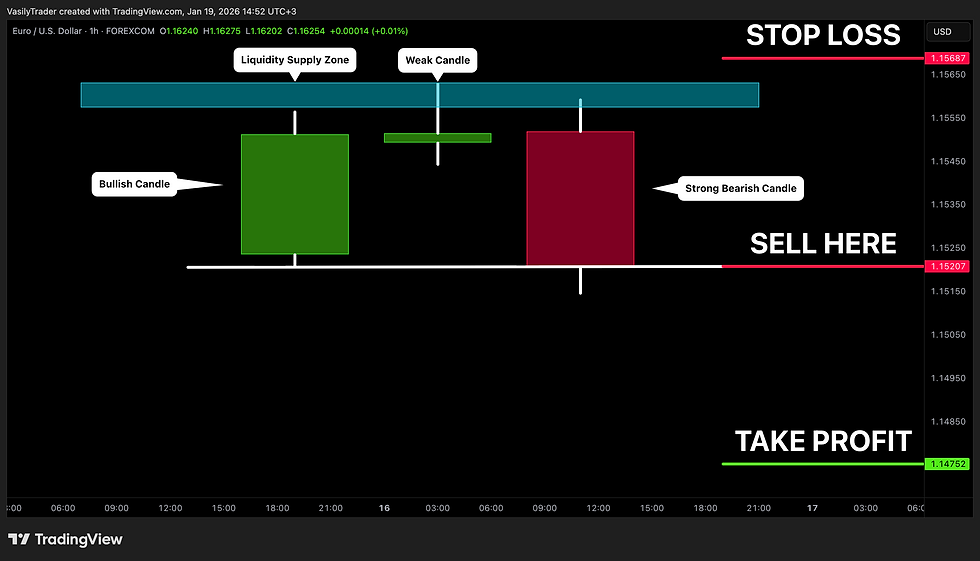
Open a sell position immediately then, placing your stop loss above the highs.
Take profit will be based on the closest strong liquidity demand zone.
Example
Here is how I used this selling imbalance model to trade GBPJPY forex pair.

90 pips of easy profits were made!
Buying Imbalance Price Model
Now, let's discuss a bullish model.
It should also be based on 3 consecutive candlesticks.

The first one should be a normal bearish candle with an average-sized body and relatively small wicks.
It will signify a bearish sentiment on the market.
The second candlestick should be a weak bullish, bearish candle, or doji.
It can also be a pin bar with a long lower wick.
Such a candle should strictly form after a test of a liquidity demand zone.
A formation of such a candle will signify an absorption of selling orders by the buyers, by the buying orders that are placed within a demand zone.
The lower wick may also go beyond a liquidity zone. It will signify a liquidity grab and a trap for the sellers.
The third candle should be a strong bullish candlestick with a big body.
The body of this candle should engulf the entire range of the first bearish candle.
It will signify a strong buying imbalance and confirm a change of the market sentiment.
A bullish continuation will be expected then.
Buying Imbalance Strategy
To trade this pattern, simply wait for a bullish imbalance candle to close, engulfing the first bearish candle.

Open a buy position immediately then, placing your stop loss below the lows.
Take profit will be based on the closest strong liquidity supply zone.
Example
Here is an example of how this candlestick pattern helped to identify a buying imbalance on EURCHF pair.

Following trading execution rules described above, 14 pips of profits were easily made.
This powerful candlestick model can be observed on any market.
Being relatively rare, it provides very profitable trading opportunities.
Learn to identify that following the rules that I described.
It will be the best imbalance confirmation for your trades.


