How to Use Fibonacci Levels in Gold Trading. Best Fib.Retracement Ratios for XAUUSD Analysis Strategy Explained
- VasilyTrader

- Aug 19, 2025
- 2 min read

I will teach you a simple but efficient way of using Fibonacci levels for Gold analysis.
You will learn the strongest Fib.retracement levels and a proven strategy for XAUUSD trading.
Best Fibonacci Levels
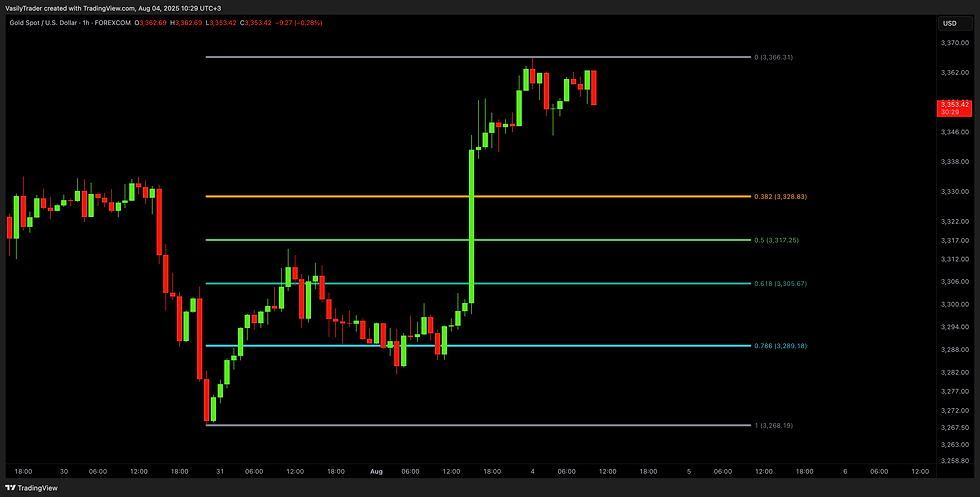
First, let me show you the most powerful Fibonacci retracement levels that you should use for trading Gold.

The most significant ones are:
382,
50,
618,
786.
Price Action Analysis
To use these Fib.Retracement levels properly, you will need to find the strongest 3 impulse legs.
Please, note that you can execute Fibonacci analysis of Gold on any time frame, for the sake of the example, we will do that on a daily.

Here are 3 impulses that I found.
I was simply trying to identify the price waves with the strongest impact. I underlined them from their lows to their highs.
Fibonacci Retracement Drawing
We will draw Fibonacci Retracement levels based on these 3 movements.
We plot Fib.Retracement of a bullish impulse from its low to its high.
We plot Fib.Retracement of a bearish impulse from its high to its low.

That is how it looks.
Fibonacci Confluence Zones
After that we will need to find a confluence - zones or levels where Fib.Retracement levels of different impulses match.
Such zones will be significant liquidity clusters where market participants will place huge volumes of trading orders.
Specific Confluence Zones
The first 2 confluence zones that I spotted on a Gold chart will be specific. They are based on 1 and 0 Fib.Retracement levels that match.

These 2 areas are both completion and starting points of our impulse legs.
The fact that significant price movements completed and started after tests of these zones indicates their importance.
Classic Confluence Zones
Confluence zones 3/4/5/6 are based on a convergence of at least 2 Fib.Retracement levels of different impulses.

Probabilities will be high that these zones will attract the market liquidity.
The Last Step
After we found all confluence zones, I recommend removing Fibonacci levels from the chart to keep it clean.

That is how our complete Fib.Analysis will look.
How to Use Confluence Zones
From these zones, we will look for trading opportunities.
The areas that are above current price levels will be significant supply areas, and we will look for sell signals from them.
The zones that are below Gold spot price will be demand areas. Chances will be high that a strong buying reaction will follow after their test.
Confluence zones that we spotted on Gold chart provide unique perspective. Integrating them in your XAUUSD analysis, you will increase the accuracy of your predictions and trading decisions.


