
How to Trade Price Action With Top-Down Analysis. Real Example (Forex)
- VasilyTrader

- Jun 3
- 3 min read

I will show you a simple way to trade price action using Top-Down Analysis.
I will explain how to use a combination of 2 time frames to find profitable setups on Forex.
Best Time Frames to Use
We will use daily and 4H time frames for trading this strategy.
Remember that you should strictly start the analysis from a higher time frame.
It means you always start with a daily time frame, and you analyse a 4H time frame when you complete daily time frame analysis.
Daily Time Frame Analysis
A daily time frame analysis is the core of this strategy.
It is used for tracking reversals and shifts in the market sentiment.
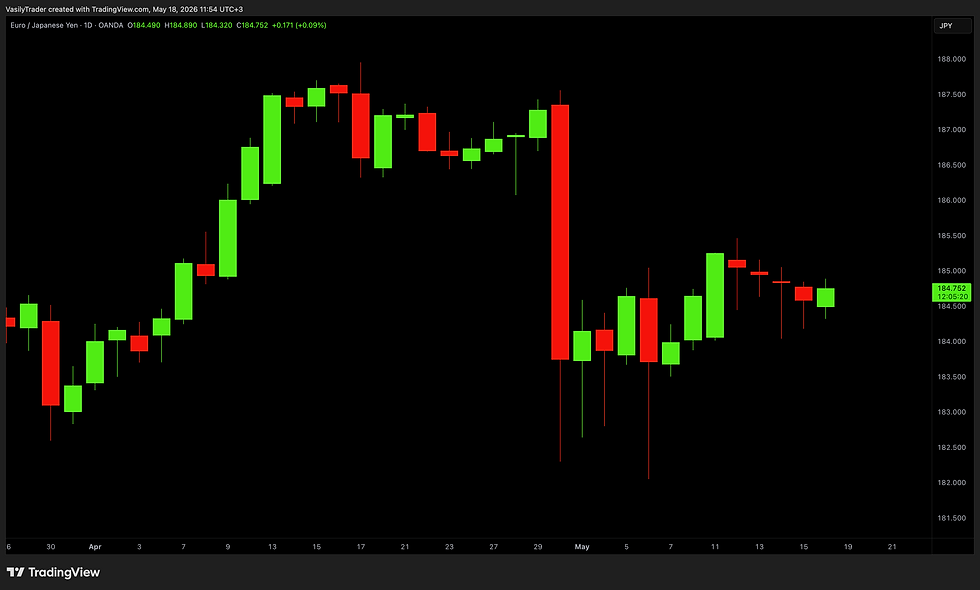
Above is the current price action on EURJPY on a daily time frame.
Structure Mapping
The first thing that we will start our analysis with is a basic structure mapping.

We simply map significant highs and lows.
Market Structure Analysis
After that, we will conduct a market structure analysis, using structure mapping.
We can see that after the last strong bearish wave, EURJPY pair started to consolidate.

After the completion of the consolidation, the market established an uptrend with a confirmed bullish reversal.
After the price set the last higher high in the current bullish trend, a minor bearish movement started.
Based on this structure analysis, we can make a prediction that the price will continue growing soon.
The next bullish wave will initiate after the market completes the current pullback.
To accurately predict its completion we will use 4H time frame analysis.
4 Hour Time Frame Analysis
After we complete market structure analysis on a daily, we can start analysing a 4H time frame.
4 hour time frame analysis will be used for confirmations and entries.

Structure Mapping

Market Structure Analysis
After we complete structure mapping on a 4H time frame, we need to analyse market structure.

As you can see, after forming a strong bearish wave, the market started to trade in an intraday uptrend.
It was violated then, and currently, the pair is trading in an intraday downtrend.
The current bearish movement that we spotted on a daily time frame represents an intraday bearish trend on a 4H.
To confirm the completion of a correction on a 4H time frame, we need an intraday bearish trend to be violated.

A bullish change of character CHoCH and a violation of the level of the last lower high will confirm a trend violation and the start of a new intraday bullish trend.
That will be a strong confirmation signal for us.
Trading Plan
After we complete the analysis of 2 time frames, we can build a trading plan.
Let me show you how.

After a confirmed bullish change of character on a 4H time frame
set a buy limit order on a retest of the broken level of the last lower high,
take profit is the closest strong daily structure.
stop loss is strictly below the lows on a 4H.
That is going to be our complete plan to follow.
Summary
Top-down analysis and basic structure mapping are a powerful combination for profitable trading any Forex pair.
Basic price action principles of market trend analysis can help you spot very good entries.
I hope this strategy will help!


