


How to Find Support & Resistance, Key Levels on Crude Oil Chart (for beginners)


Today, I will teach you how to execute support and resistance analysis on Crude Oil.
You will learn how to identify strong supports and resistances, key levels, the best time frame for analysis, and a lot of useful tips.
Time Frame to Use
The method that I will teach you works on any time frame.
The strongest and most significant supports and resistances will be on a daily time frame.
Step 1 - Key Levels
Start with the identification of important highs and lows based on candle wicks.
It should be the points-levels where a strong bullish or bearish reversal occurred.
We will call such levels - key levels.
These levels will provide the base for supports and resistances.

Let's take WTI Crude Oil chart on a daily time frame and find key levels.

Above, I marked all significant historic price levels based on lows/highs of wicks.
Step 2 - Invalid Key Levels
Some of the levels that we spotted are invalid.
It happens because key levels lose significance with time.
To identify an invalidated key level, check how the price reacted to it after it was formed.

We have a bunch of historic key levels that lost their importance after their consequent tests.
It means that neither bearish nor bullish movements stopped initiating from these levels.
We should remove such levels from our chart.

You can find key levels that remain significant on the chart above.
Step 3 - Support and Resistance zones
Key levels that we identified will compose support and resistance zones.
Resistance zones are structure clusters above current prices.
Support zones arb structure clusters below current prices.
The upper boundary of a resistance zone will be a key resistance level.
Its lower boundary will be the closest highest candle close.
The lower boundary of a support zone will be a key support level.
Its upper boundary will be the closest lowest candle close.
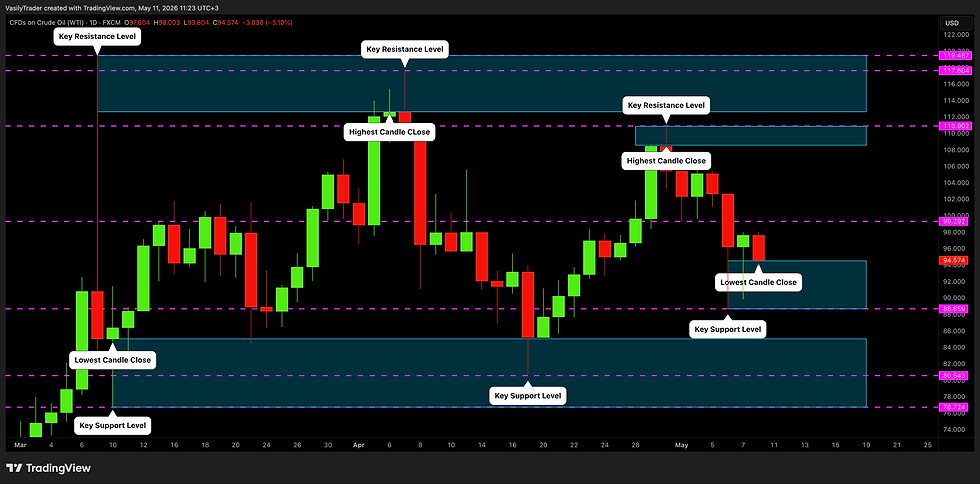
That's how it works in practice.
As you can see, some key levels will lie within the same support or resistance zone.
Such zones will be stronger.
Broken Zones
There is one exception that you need to remember about.
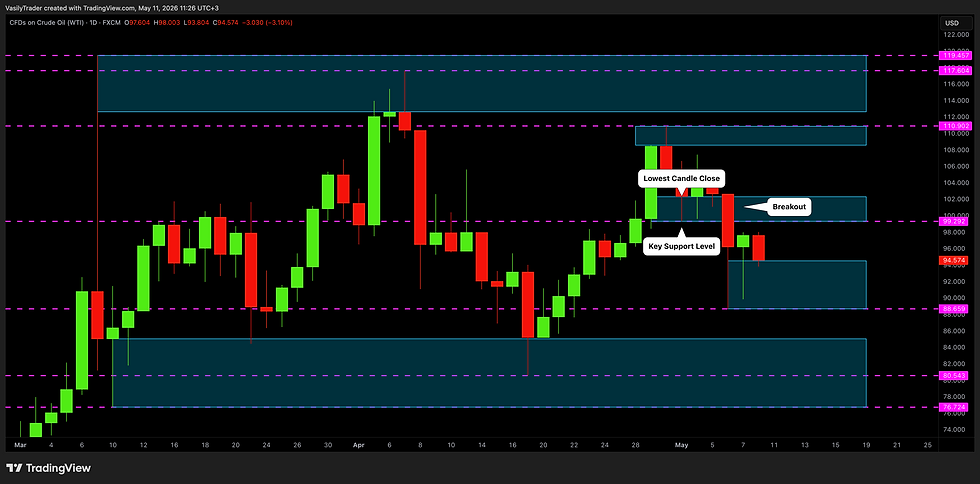
We have a key support level in the middle of the price chart.
It was broken, and it turned into a resistance after a breakout.
As it was initially a support, we draw that using the rules of a support zone drawing, even though the price is currently below that.
Complete Support & Resistance Analysis
Here is how a complete support and resistance analysis on Crude Oil looks.
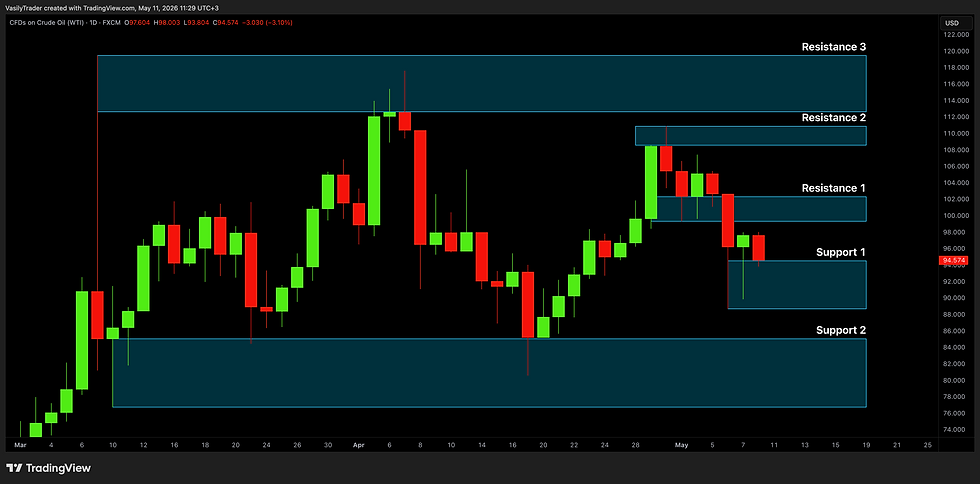
As you can see, I removed key levels from the chart to make it clean.
Summary
Using this method, you will accurately find important supports and resistances on Crude Oil.
Make sure that you start with key levels identification, check their validity, and only then draw support and resistance zones.


