
PRICE ACTION TRADING | THREE TYPES OF TRIANGLE YOU MUST KNOW 📐
- VasilyTrader

- Jun 1, 2022
- 2 min read
Updated: Sep 16, 2024

Hey traders,
In this post, we will discuss 3 simple and profitable types of a triangle pattern.
1️⃣ The first type of triangle is called a descending triangle.
It is a reversal price action pattern that quite accurately indicates the exhaustion of a bullish trend.
Setting a new higher high the market retraces and sets a higher low, then bulls start pushing again but are not able to retest a current high and instead the price sets a lower high and drops to the level of the last higher low setting an equal low.
Multiple lower highs compose a horizontal support that is called a neckline.
The price keeps trading in such a manner, setting lower highs and equal lows till the price sets a new lower low.
Most of the time, it gives a very accurate signal of a coming bearish move.
Please, note that a triangle formation by itself does not give an accurate short signal. The trigger that you should wait for is a formation of a new lower low.
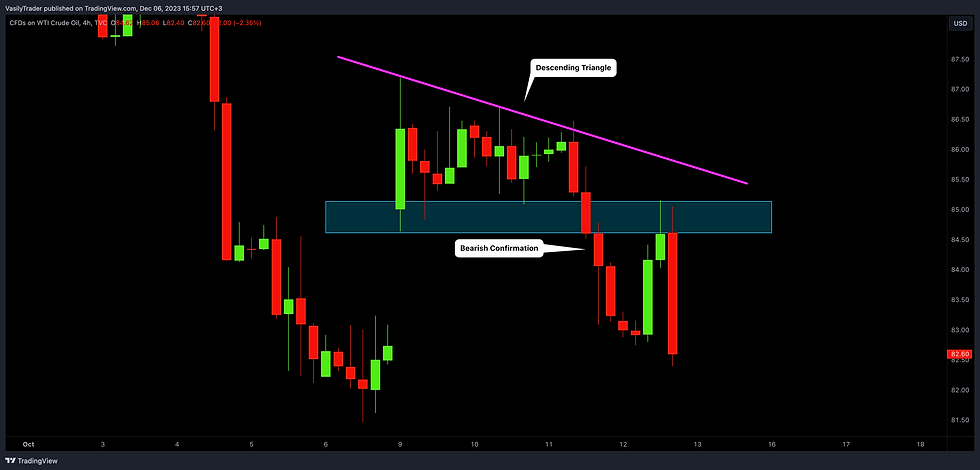
Take a look at a descending triangle formation that I spotted on Crude Oil on a 4H time frame. Bearish movement was confirmed after a breakout of the neckline of the pattern.
2️⃣ The second type of triangle is called a symmetrical triangle. It is a classic indecision pattern. It can be formed in a bullish, bearish trend, or sideways market.
The price action starts contracting within a narrowing range, setting lower highs and higher lows.
Based on them, two trend lines can be drawn.
Breakout of one of the trend lines with a quite high probability indicates a future direction of the market.

Above is a great example of a symmetrical triangle.
Bullish breakout of its upper boundary - a falling trend line was a strong bullish confirmation.
3️⃣ The third type of triangle is called an ascending triangle.
It is a reversal price action pattern that quite accurately indicates the exhaustion of a bearish trend.
Setting a new lower low, the market retraces and sets a lower high, then bears start pushing again but are not able to retest a current low and instead the price sets a higher low and bounces to the level of the last lower high setting an equal high.
A sequence of equal highs compose a strong horizontal resistance that is called a necklien.
The price keeps trading in such a manner, setting higher lows and equal highs till the price sets a new higher high.
Most of the time, it gives a very accurate signal of a coming bullish move.
📍Please, note that an ascending triangle formation by itself does not give an accurate long signal. The trigger that you should wait for is a formation of a new higher high.

Ascending triangle formation helped me to accurately predict a bullish reversal on USDJPY. Its neckline breakout was a strong bullish confirmation.
Learn to recognize such triangles and you will see how accurate they are.
Let me know what pattern do you want to learn in the next post?


